
The Price of Waiting
AI answers increasingly shape how buyers discover options and form shortlists. Every month a brand is missing from relevant AI answers, some prospects are forming shortlists without it. That creates economic exposure, and the exposure can be estimated.
Using published research and illustrative assumptions, our model shows how modeled 12-month exposure from weak AI visibility can reach roughly $1.5 million to $1.7 million for illustrative mid-size higher education, manufacturing and B2B software organizations, and about $350,000 for a mid-size ecommerce brand.
Acting sooner may matter because category leadership can become persistent. A study of 1,094 US categories in ChatGPT found that 15.2% had a clear brand leader, while 53.7% were still unsettled. Once a leader emerged, it stayed on top in 90.4% of month-over-month comparisons.
Below are the formula, four worked scenarios and the steps to run the numbers for your own organization.
Key Takeaways
- Weak AI visibility can create significant economic exposure. In four illustrative scenarios, the modeled 12-month cost of delay ranges from $351,000 to $1.7 million.
- The model uses several deliberately restrained inputs. It counts first-year value, holds AI adoption flat and applies no AI-referral conversion premium.
- The largest uncertainty is the AI visibility impact factor. Organizations can improve the model by combining measured AI visibility with their own funnel and customer-value data.
What Do GEO and AEO Mean?
Generative Engine Optimization (GEO) is the practice of improving how a brand is found, cited and described in AI-generated answers from tools such as ChatGPT, Google AI Overviews and AI Mode, Gemini, Perplexity and Copilot. Answer Engine Optimization (AEO) is a closely related term. It began with featured snippets and voice assistants, and today it is often used interchangeably with GEO. This article uses GEO to cover both.
Where Discovery Happens Now
AI answers now sit between buyers and websites across a growing share of discovery journeys:
- ChatGPT reaches a “collective 1.2B weekly users” (OpenAI, September 2026).
- Gemini has 950 million monthly active users, with daily active users tripling in the last year (Alphabet, July 2026).
- 49% of US adults use AI chatbots, up from 33% in 2024, with use rising in every age group. 42% use chatbots to search for information, and 60% read the AI summaries at the top of search results (Pew Research Center, June 2026, 5,119 US adults; the 2024 question wording differed slightly).
- $750 billion in US consumer spend is projected to flow through AI search by 2028 (McKinsey, October 2025).
Google search is not shrinking. Alphabet reports queries at an all-time high (Alphabet, April 2026). What is changing is how often searchers need to click through to a traditional result. When an AI summary appears, users click a traditional result on 8% of visits, against 15% without one (Pew Research Center). Brands cited inside the answer earn 120% more organic clicks than brands left out (Seer Interactive, April 2026).
How Do You Calculate the Cost of Delaying GEO?
Cost of delay is the value lost for each unit of time a decision waits. For GEO, it is the modeled revenue exposure associated with each month a brand has weak visibility in the AI answers its buyers use.
Monthly cost of delay = A × R × G × C × V
| Input | What it measures | How we set it |
|---|---|---|
| A | Addressable prospects per month | Illustrative, per industry |
| R | Share of prospects who research with AI | Published research for that audience |
| G | AI visibility impact factor: share of AI-influenced opportunities potentially affected by low AI visibility | 25% assumption in every example |
| C | Conversion rate from prospect to customer | Illustrative industry benchmark |
| V | Value per conversion | Illustrative, first-year value only |
We use 25% as an illustrative AI visibility impact assumption. It is not a measured loss rate. Seer Interactive found that brands cited in Google AI Overviews earned about 20,700 organic clicks per million impressions, compared with about 9,400 for brands that were not cited, a gap of roughly 54%. We use less than half that difference as a conservative proxy for the share of AI-influenced opportunities potentially affected by weak visibility. Because AI is only one input in most purchase decisions, organizations should replace this assumption with measured visibility and funnel data wherever possible.
Three other inputs are deliberately restrained: the model counts first-year value only, it holds AI adoption flat even though it is rising, and it gives AI-referred visitors no conversion premium.
Four Worked Scenarios
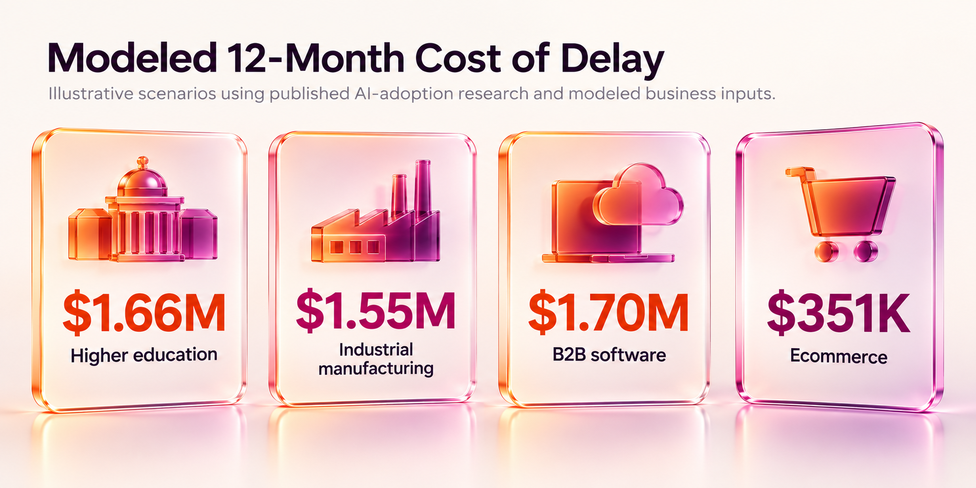
The table applies the formula to four illustrative mid-size organizations. The adoption rate (R) for each comes from published research on that audience. Replace A, C and V with your own figures. These are scenario outputs, not estimates of any specific company’s actual lost revenue.
| Step | Higher education | Industrial manufacturing | B2B software | Ecommerce |
|---|---|---|---|---|
| A. Prospects per month | 1,500 inquiries | 300 qualified buyers | 1,000 in-market buyers | 100,000 in-market shoppers |
| R. Research with AI | 46% | 69% | 63% | 39% |
| Prospects using AI | 690 | 207 | 630 | 39,000 |
| G. AI visibility impact factor (assumed) | 25% | 25% | 25% | 25% |
| Opportunities at risk | 173 | 52 | 158 | 9,750 |
| C. Conversion rate | 4% inquiry to enrollment | 10% win rate | 3% prospect to customer | 2.5% |
| Conversions lost per month | 6.9 enrollments | 5.2 deals | 4.7 customers | 244 orders |
| V. Value per conversion | $20,000 first-year net tuition | $25,000 average deal | $30,000 first-year contract | $120 average order |
| Modeled monthly cost of delay | $138,000 | $129,375 | $141,750 | $29,250 |
| Modeled six-month cost | $828,000 | $776,250 | $850,500 | $175,500 |
| Modeled 12-month cost | $1,656,000 | $1,552,500 | $1,701,000 | $351,000 |
Higher education
46% of high school students used AI tools in their college search, up from 26% about six months earlier (EAB, 5,000+ students). The same survey found 18% removed a college from consideration based on AI results. Parents are there too: 57% have used AI to evaluate colleges (EAB, August 2026). Our model counts one year of tuition, so the full lifetime-value exposure could be larger.
Industrial manufacturing
69% of technical buyers use generative AI during the purchasing process, and the share who never use it fell from 42% to 31% in one year (TREW Marketing and GlobalSpec, March 2026). Shortlists form early: the vendor a buyer prefers before first contact wins about 80% of deals (6sense, 4,000 buyers). A brand absent from AI research may never reach the RFQ stage.
B2B software
63% of technology buyers used AI during their purchase (TrustRadius, 1,862 buyers). 51% of software buyers now start research with an AI chatbot more often than with Google, and 69% chose a different vendor than planned because of chatbot guidance (G2, April 2026).
Ecommerce
39% of US consumers have used AI for online shopping (Adobe, 5,000+ consumers). AI-referred retail visitors converted 54% better than other traffic and generated 53% more revenue per visit in May 2026, a year after converting at about half the rate (Adobe). Our model does not apply that premium. Lower order values keep the modeled monthly figure smaller, but it recurs every month.
Why Can Delaying GEO Get More Expensive?
The modeled monthly figures above may understate the cost of a long delay, for three reasons.
- Leaders tend to hold their position. In ChatGPT, 53.7% of categories are still unsettled. Among high-demand topics, only 11.3% had a clear owner. Where an owner exists, it stayed on top in 90.4% of month-over-month comparisons (Semrush, 50,000+ brands, July 2026).
- The signals AI engines reward take time to build. Branded web mentions show the strongest correlation with AI Overview visibility (0.664), far ahead of backlinks (0.218). Brands in the bottom half for mentions are close to invisible (Ahrefs, 75,000 brands). A late starter begins that work behind competitors who started earlier.
- Adoption keeps rising. Student AI use in college search nearly doubled in six months, and Google AI Mode queries are more than doubling every quarter (Google, May 2026). As adoption rises, the same month of delay can carry a higher cost than it did earlier.
What the Numbers Do Not Say
Limits of the model:
- The inputs are illustrative. A, C and V are example values, and G is an assumption. Your own figures will move the result up or down.
- AI referral traffic is still small. AI platforms send a low single-digit share of most sites’ traffic (Similarweb). Most of the cost sits in shortlists and consideration, which analytics tools do not capture as clicks.
- Conversion premiums vary. A peer-reviewed study of 973 ecommerce sites found ChatGPT referrals converted below most traditional channels in 2025 (Kaiser and Schulze). That is why our model applies no premium.
- Traditional search remains large. Gartner predicted a 25% drop in search engine volume by 2026 (Gartner). That has not happened. GEO adds to search strategy; it does not replace it.
- Citations shift. 40% to 60% of the domains cited for the same prompt change from one month to the next (Profound). Visibility has to be measured and maintained, not earned once.
How Do You Calculate Your Own GEO Cost of Delay?
- Set A from your CRM or analytics: monthly inquiries, qualified leads or in-market shoppers.
- Set R from the audience research above, or survey your own prospects on how they research.
- Estimate G. Measure your current AI visibility by running the questions your buyers ask across the major AI engines and comparing how often your brand appears with competitors. Use that visibility gap, together with any available funnel or buyer-research data, to set an appropriate impact factor. The scenarios here use 25%.
- Use your own C and V. First-year value gives a conservative case; lifetime value gives the full one.
- Compare the modeled monthly cost of delay with the investment required to improve GEO performance. That comparison shows how quickly the potential cost of continued delay can exceed the cost of acting.
Frequently Asked Questions
What is the cost of delaying GEO?
The cost of delaying GEO is the modeled business exposure associated with weak visibility in the AI answers buyers use during research and decision-making. The amount depends on how many prospects use AI, how often the brand is missing, its conversion rate and the value of each conversion.
How do you calculate GEO cost of delay?
RDA’s model uses five inputs: addressable prospects per month, the share that research with AI, an AI visibility impact factor, conversion rate and value per conversion. Multiplying those inputs estimates the monthly revenue exposure associated with weak AI visibility.
What is the AI visibility impact factor?
The AI visibility impact factor estimates the share of AI-influenced opportunities potentially affected by weak visibility. The scenarios in this article use 25% as an illustrative assumption, not a measured loss rate. Organizations should refine that assumption using measured AI visibility, funnel data and buyer research.
Why can waiting to improve AI visibility become more expensive?
Delay can become more expensive because AI adoption continues to rise, authority signals take time to build and brands that establish category leadership can retain that position. That means competitors can continue accumulating visibility while a brand that waits begins later.
What is the difference between GEO and AEO?
The terms overlap and are often used interchangeably. AEO originally focused on earning direct answers in search features such as featured snippets and voice results. GEO focuses on visibility in answers produced by generative AI tools. Both aim to make a brand the source an answer engine cites or recommends, and both build on SEO rather than replace it.
Does GEO replace traditional SEO?
No. Traditional search remains an important discovery channel. GEO extends search strategy by measuring and improving how a brand appears inside AI-generated answers, where visibility may depend on owned content, technical accessibility, third-party sources and authority signals.
Next Steps
The largest uncertainty in most cost-of-delay calculations is G: how much weak AI visibility affects the opportunities that matter. RDA’s GEO Audit replaces assumed visibility with measured performance across major AI engines, competitor benchmarks and the content and authority gaps behind the result. Combined with your own funnel data, that gives teams a more defensible basis for setting G and estimating how much delay may be costing them.